The challenge
Understand purchasing patterns and explore meaningful customer segments. The project looks at how demographics and income relate to spending, and whether different customer groups engage with the brand differently.
The approach
The analysis starts with cleaning and exploratory visualization of the key distributions, then tests relationships between variables with chi-squared tests before building K-NN and regression models to predict purchasing behavior.
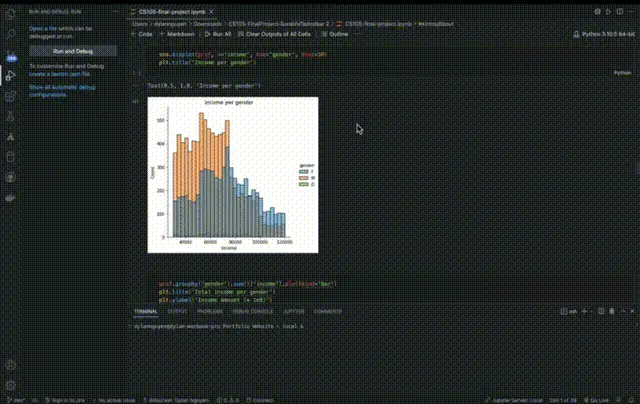
- Exploratory analysisDistributions of age, income and spending across demographic groups.
- Hypothesis testingChi-squared tests on demographic and spending relationships.
- Predictive modelingK-NN classification and regression to model purchasing behavior.
Analysis workflow
- 01CleanHandle missing values and encode features
- 02ExploreVisualize key distributions
- 03TestChi-squared on relationships
- 04ModelK-NN and regression