Data analysis study

Santa Barbara Home Price Analysis

A Python pipeline that scrapes sold single-family homes from Trulia, cleans them into a SQLite table and explores what drives price in Santa Barbara.

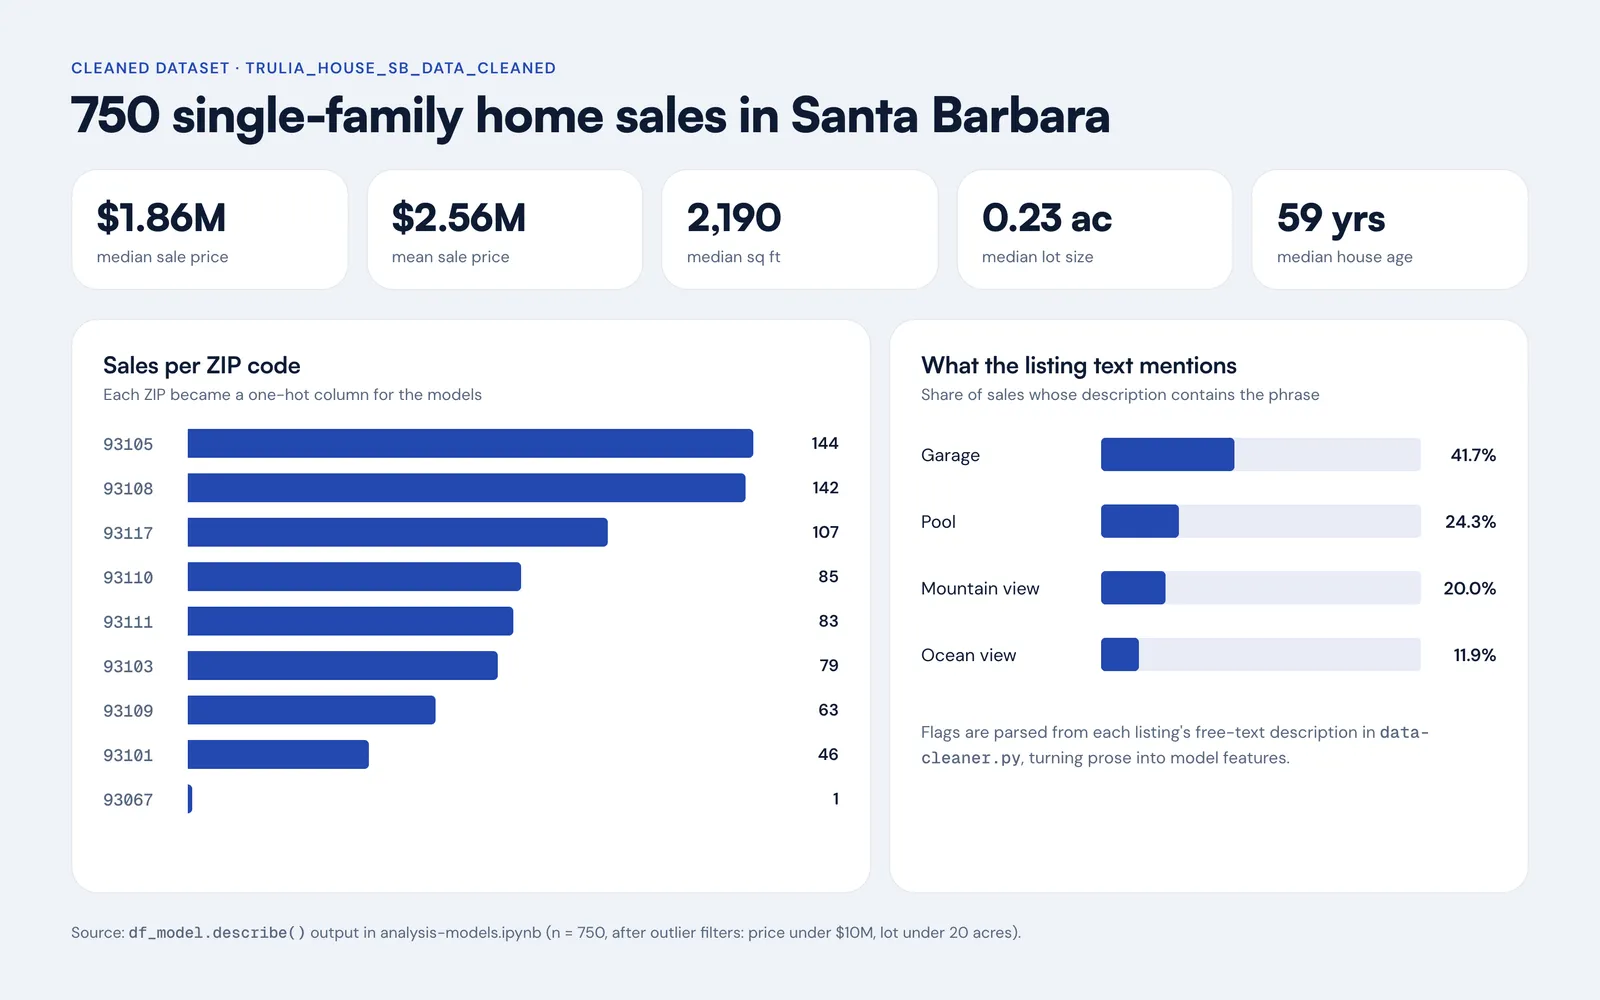
Dataset summary of 750 Santa Barbara home sales: median price $1.86M, sales per ZIP code and how often listings mention a garage, pool or view
750home sales in the cleaned dataset
9ZIP codes one-hot encoded
6features parsed from listing text

The challenge

Santa Barbara home prices run from under half a million to almost ten million dollars, and listing sites show them one house at a time. There is no clean table of what sold, what it was like and where it was.

I wanted to build that table myself so I could ask which features actually move price: size, lot, age, ZIP code, or the things agents highlight in the description.

The approach

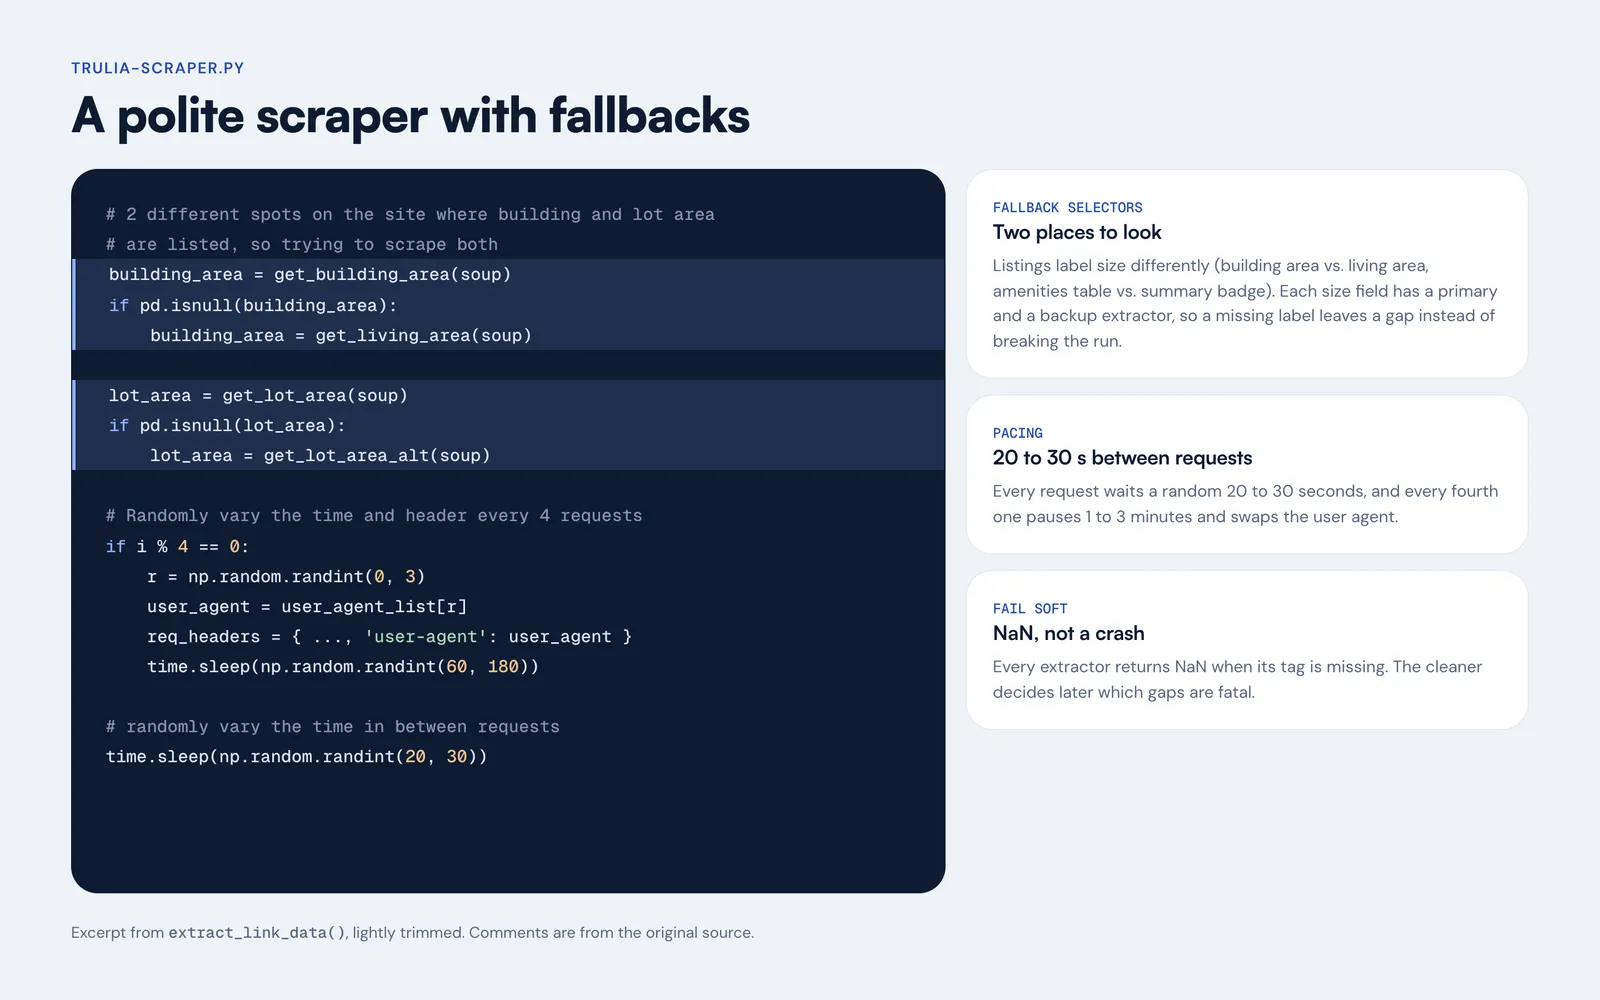
A Requests and BeautifulSoup scraper walks Trulia's sold-homes search for Santa Barbara, opens every listing and pulls price, beds, baths, size, lot and year built. It waits a random 20 to 30 seconds between requests, rotates user agents and tries a backup selector whenever a field is missing. Everything lands in SQLite, so the analysis never has to touch the site again.

The most useful trick is in cleaning. Descriptions are free text, so the cleaner scans each one for phrases like "ocean view", "pool" and "garage" and turns them into 0/1 features. The notebooks then test price differences across ZIP codes with a one-way ANOVA built by hand, one-hot encode the nine ZIPs, check feature overlap with PCA and mutual information, and set up OLS and CatBoost models on log-transformed price.

  • Polite, resilient scraperRandomized pacing, rotating user agents and a backup extractor for each size field.
  • SQLite hand-offRaw and cleaned tables share one SQLite file, so each step reruns on its own.
  • Text to featuresSix 0/1 flags parsed from listing descriptions, from garage to ocean view to Isla Vista.
  • Statistical checksA hand-built one-way ANOVA of price by ZIP code, plus PCA, K-means and mutual information.

Scrape to model

  1. 01ScrapeTrulia sold listings, paced
  2. 02StoreRaw rows into SQLite
  3. 03CleanOutlier filters and text flags
  4. 04ModelOne-hot ZIPs, log price, OLS and CatBoost
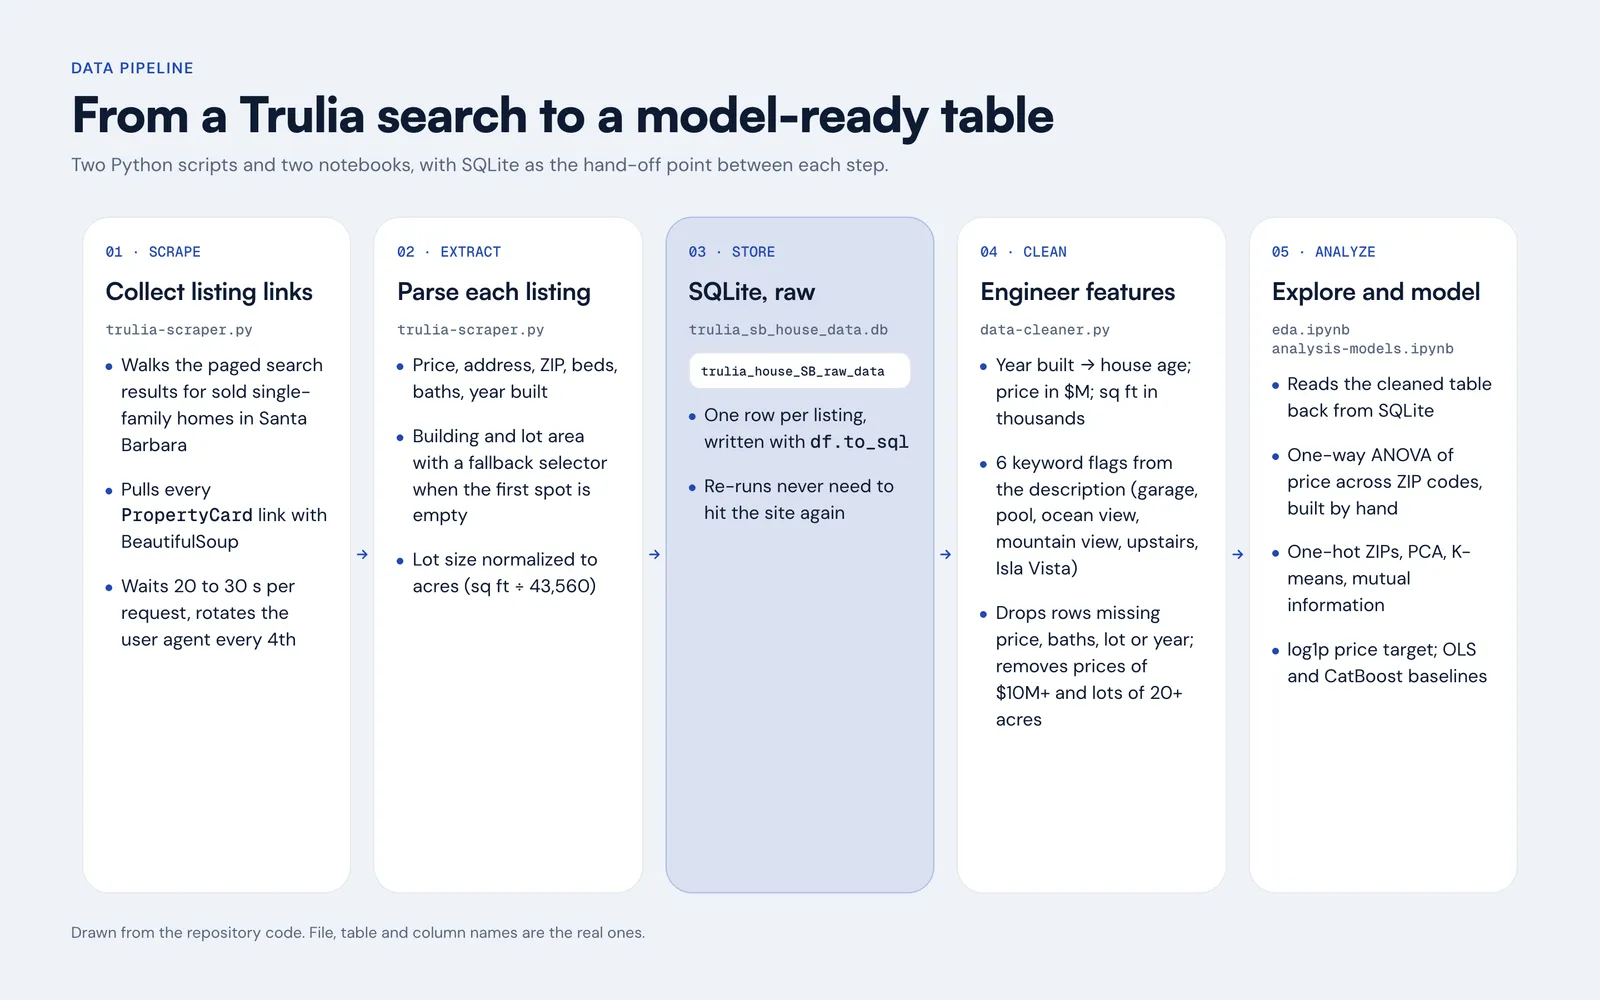
Five steps, one SQLite file.

Two scripts and two notebooks pass data through SQLite: collect links, parse listings, store raw rows, engineer features, then analyze.

Pipeline diagram: scrape, extract, store in SQLite, clean, analyze

Polite, and it fails soft.

Every request waits 20 to 30 seconds, every fourth one pauses longer and swaps its user agent, and each size field has a backup extractor that returns NaN instead of crashing.

Excerpt of trulia-scraper.py showing fallback extractors and randomized request pacing

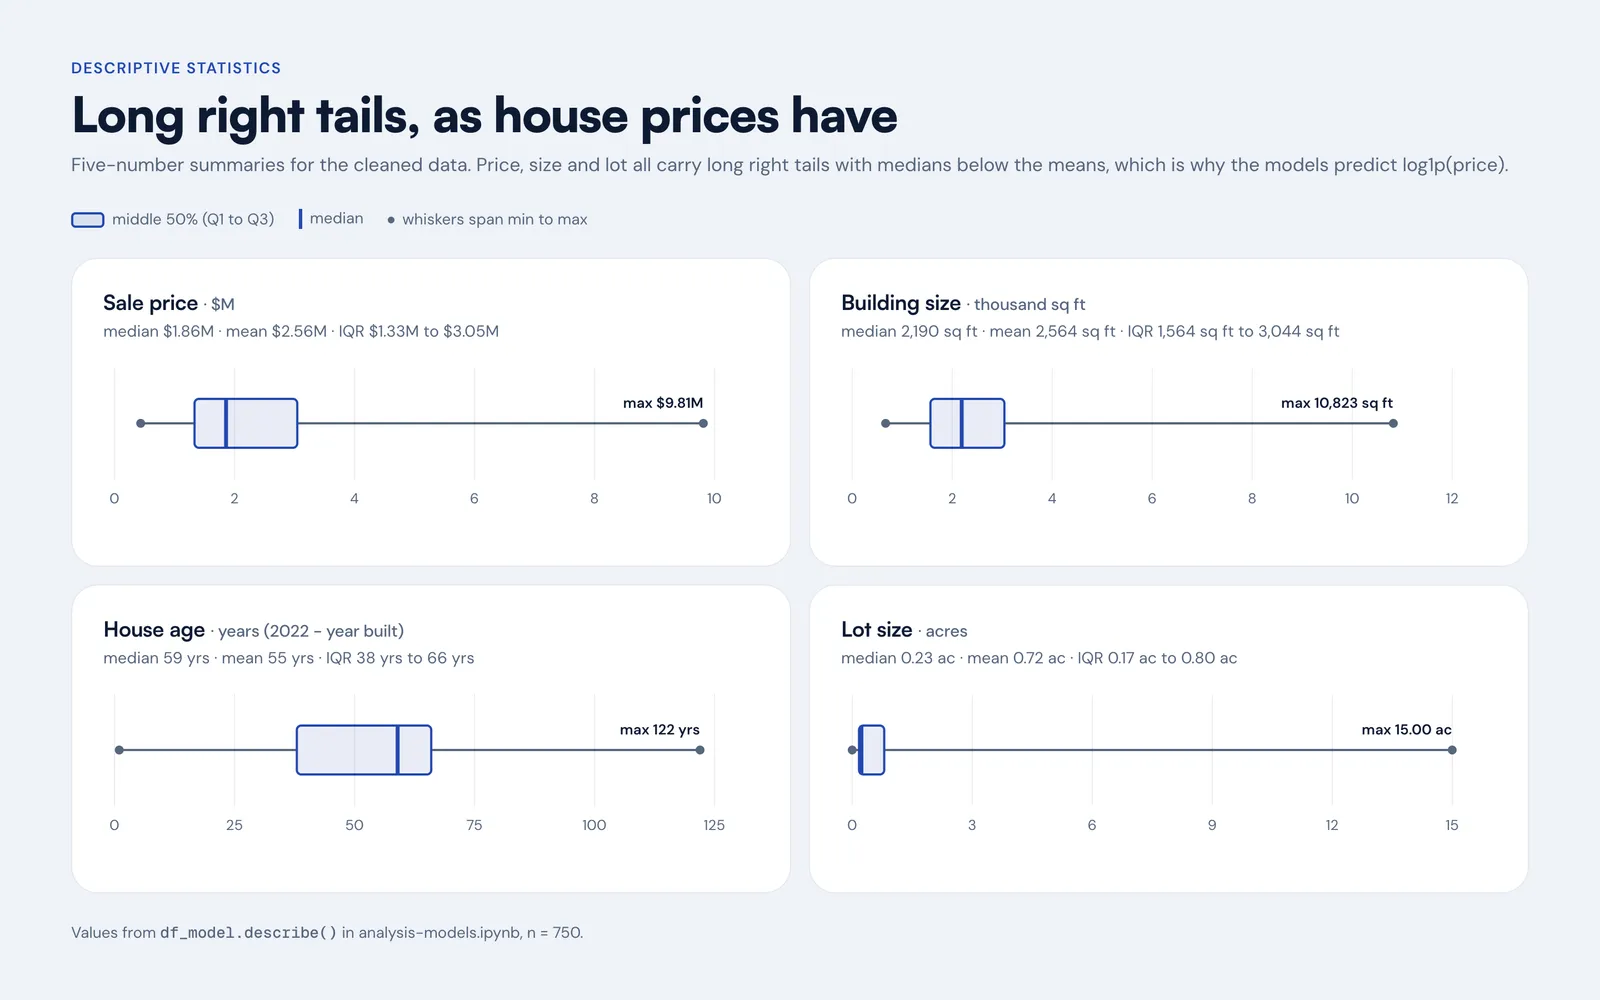
Long right tails.

Price, building size and lot size all have medians below their means, so the models predict log1p(price) rather than raw dollars.

Box plots of sale price, building size, house age and lot size for 750 sales

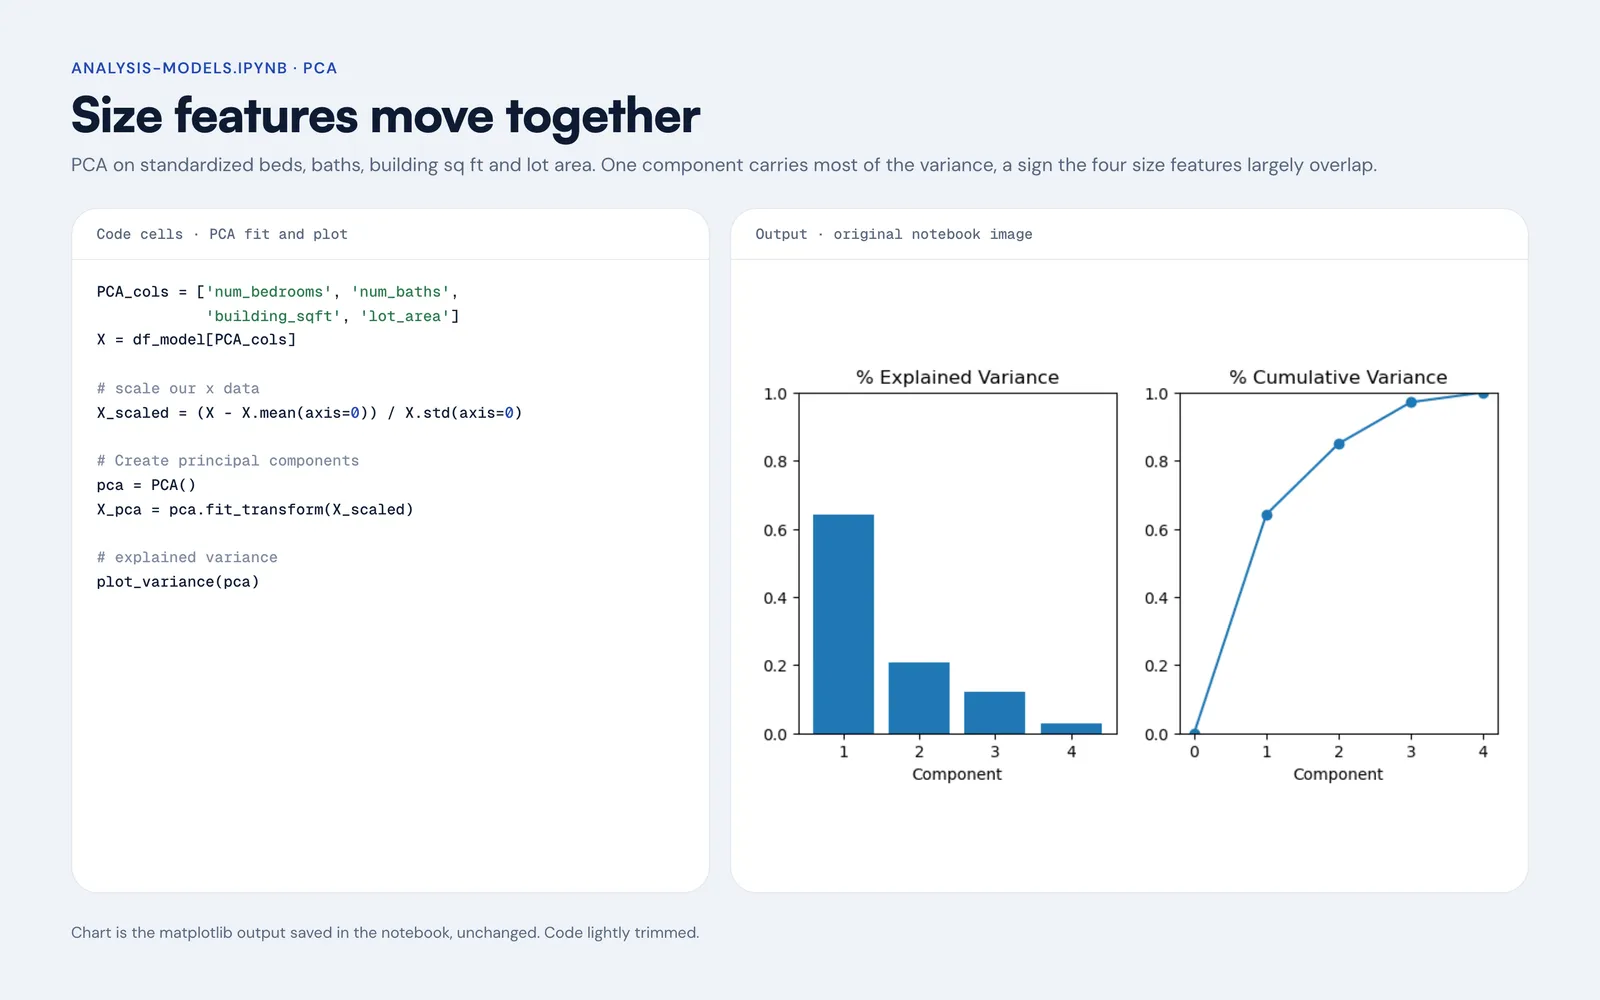
Size features overlap.

PCA on beds, baths, square footage and lot area puts about two thirds of the variance in the first component, a sign those four inputs carry much of the same signal.

Notebook PCA code beside the original explained-variance and cumulative-variance charts

Tools

  • Python
  • Requests
  • BeautifulSoup
  • Pandas
  • SQLite
  • Scikit-Learn
  • CatBoost
  • Statsmodels

Visuals are drawn from the repository code and from real outputs saved in the notebooks: the descriptive statistics for 750 sales and the original PCA chart. The scraped database is not in the repo and the saved outputs stop before model scores, so no accuracy figures are shown. Code from July and August 2022.

Next projectClarityGPTClarityGPT dashboard with a sidebar of generative tools and a conversation view